
Blood Pressure - Heart Rate Graph
The Blood Pressure graph will enable you to track your blood pressure over time, giving you a visual display. Your heart rate is graphed directly below. This data is pulled from the Blood Pressure module
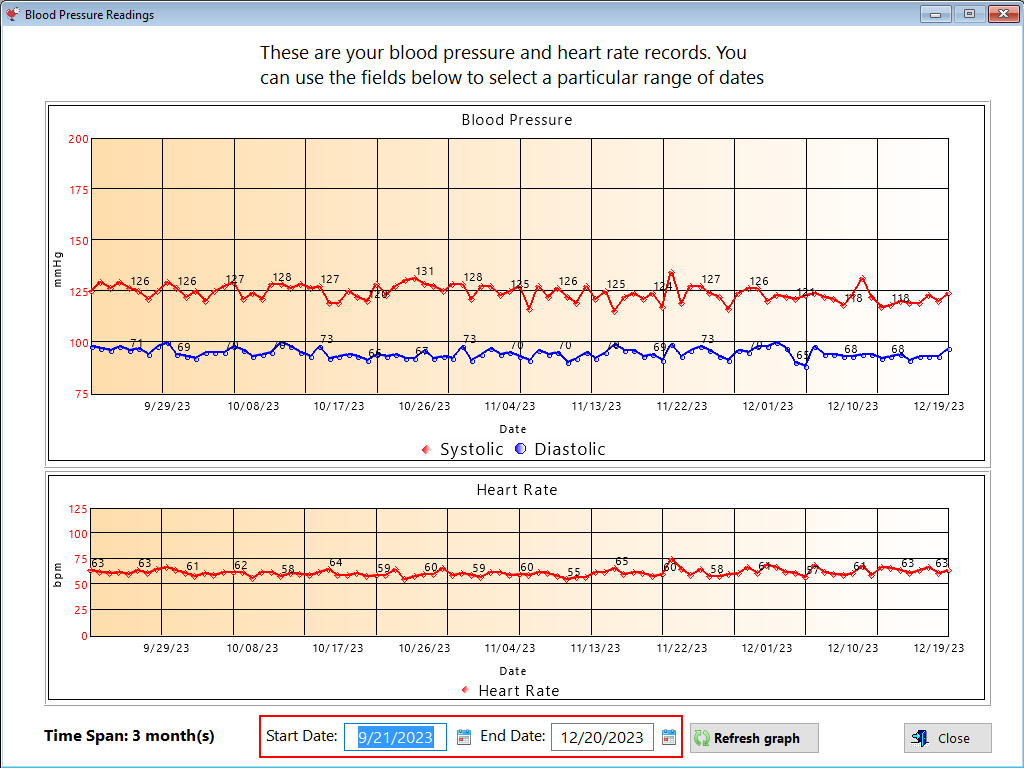
Blood Pressure - The top graph displays your systolic and diastolic blood pressure readings
Heart Rate - The bottom graph displays your heart rate readings.
This graph is designed to interpret one (1) reading per day. If you take your blood pressure more than once per day, there is a possiblity that the graph won't display the data properly.
If you Right-Click on the face of the graph, you have more options, such as printing the graph.
If you hover over a particular node, the systolic and diastolic readings will display, along with the date.
HelpID: GraphBloodPressure